> For the complete documentation index, see [llms.txt](https://support.senterasensors.com/fieldagent-documentation-updates/llms.txt). Markdown versions of documentation pages are available by appending `.md` to page URLs; this page is available as [Markdown](https://support.senterasensors.com/fieldagent-documentation-updates/analytics/crop-health-mosaics.md).
# Crop Health mosaics
What the NDVI, NDRE, and VARI crop health mosaics in FieldAgent measure, which sensors produce them, and how to view a multispectral mosaic by index or band.
A crop health mosaic is a stitched mosaic colorized by a vegetation index. Instead of showing what the field looks like, it shows how much light the crop reflects in the bands that respond to plant vigor, so thin, stressed, or weedy areas stand out from healthy canopy.
Crop health mosaics are included in every plan. They are ordered from a survey with **ORDER MOSAICS**; see [Order a mosaic](/fieldagent-documentation-updates/ordering/order-a-mosaic.md).
The demo below is a working, view-only copy of FieldAgent Web with the steps for comparing the NDVI of two flight dates. Follow them in the copy, or press **Show me** to watch each one.
{% @fieldagent-demo/embed content="compare-dates" %}
Open this demo full size
## The indices
| Index | Bands | What it responds to | Sensor needed |
| -------------------------------------------------- | -------------------------- | --------------------------------------------------------------------------------------------------------------------------------------------------------------- | ---------------------------------------------- |
| **NDVI** (Normalized Difference Vegetation Index) | Red and near infrared | Green biomass and canopy cover. The standard index for early and mid-season vigor. It saturates once the canopy closes, so late-season differences flatten out. | A sensor with a near-infrared band |
| **NDRE** (Normalized Difference Red Edge) | Red edge and near infrared | Chlorophyll and nitrogen status in a dense canopy. Keeps separating healthy from stressed plants after NDVI has saturated. | A sensor with red-edge and near-infrared bands |
| **VARI** (Visible Atmospherically Resistant Index) | Red, green, and blue | Greenness computed from visible light only. Less sensitive than NDVI, but available from any RGB camera. | Any RGB camera |
Index values run from -1 to 1. Bare soil, water, and residue fall near or below zero; healthy crop is high. Compare values within a field and between dates of the same field rather than against a fixed threshold, because sensor, growth stage, and lighting all shift the numbers.
## Which mosaic to order
| Your sensor | Order | Layer you get |
| ------------------------------------------------------ | ------------------------------------------------------------------------------------------------------------------------------------------------------- | ----------------------------------------------------------------------------------------------------------------------------- |
| RGB only (most DJI cameras) | **RGB and VARI Index Mosaics** | An RGB mosaic plus a VARI **Crop Health Mosaic** |
| Sentera 6X, Double 4K, or another multispectral sensor | **False Color NDVI and NDVI Index Mosaics**, **False Color NDRE and NDRE Index Mosaics**, or one of the **Multispectral Crop Health** band-set products | A **Crop Health Mosaic** fixed to one index, or a **Multispectral Mosaic** that can be viewed by any of its indices and bands |
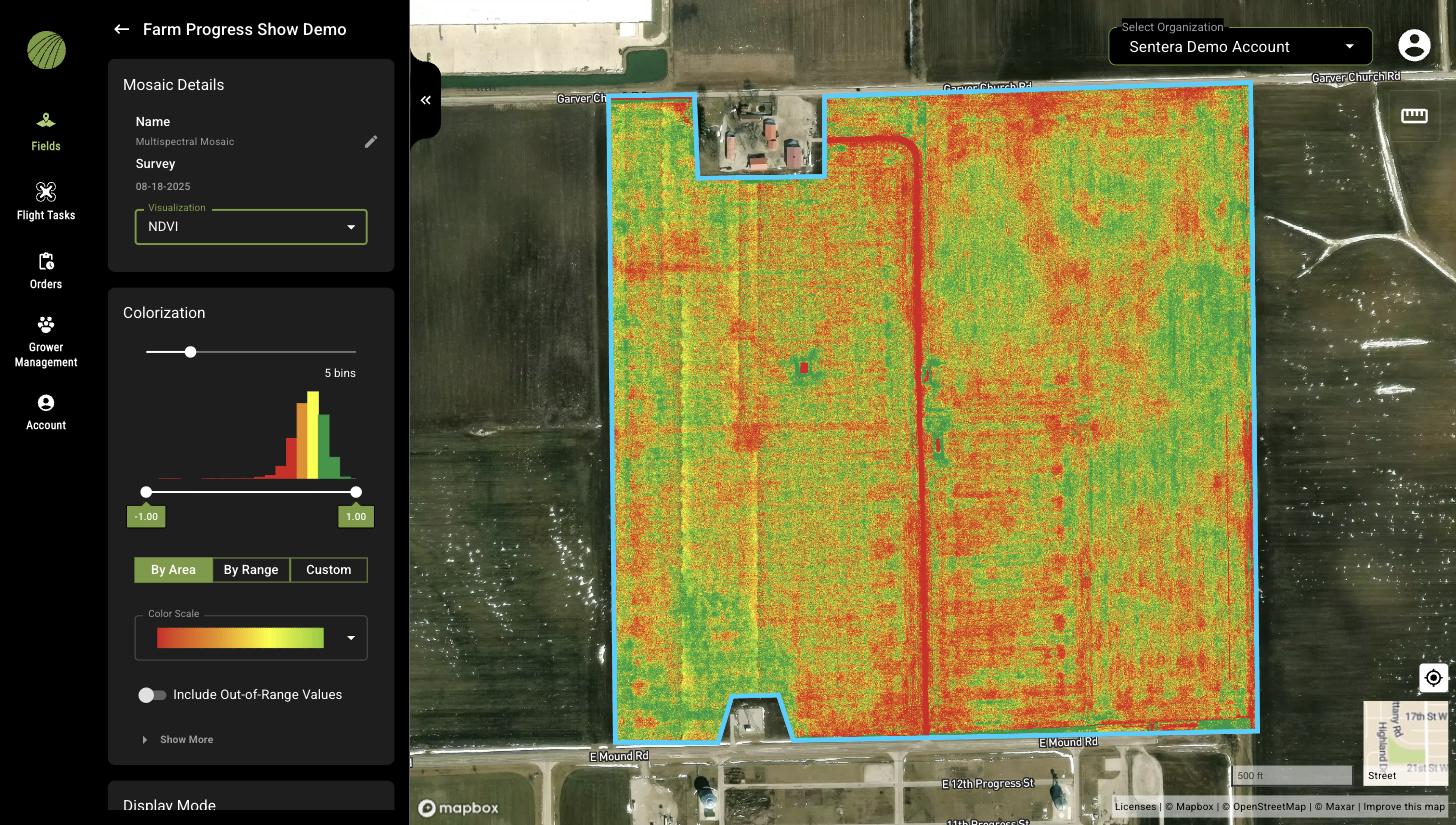
The **Multispectral Mosaic** is the more flexible choice: it stores every band the sensor captured, and the **Visualization** selector in its details switches between NDVI, NDRE, and the individual bands and composites without ordering again.
## View a crop health mosaic
1. Open the field, click the layers icon in **Map Layers**, and turn on the mosaic under its survey date.
2. Click the layer name to open **Mosaic Details**.
3. For a **Multispectral Mosaic**, pick the index or band in **Visualization**.
4. Use **Colorization** to set the bins and range; see [Colorization and visualization](/fieldagent-documentation-updates/view-and-analyze/colorization-and-visualization.md).
A multispectral mosaic viewed as NDVI.
## Put the map to work
* **Compare dates.** Turn on the same index from two flights, open the upper layer, and lower its **Opacity**, or hide and show it. Use **By Range** colorization with the same bins on both so the colors mean the same thing.
* **Compare areas.** Draw zones and read the **Average** index for each in **Zone Statistics**; see [Zones and zone statistics](/fieldagent-documentation-updates/view-and-analyze/zones-and-zone-statistics.md).
* **Find the photo.** Turn on the survey's **Photo Dots** and click the dot nearest a problem area to see the raw photo; see [Photo dots and the image viewer](/fieldagent-documentation-updates/view-and-analyze/photo-dots-and-image-viewer.md).
* **Write a prescription.** Switch **Display Mode** to **Zone Rx (Beta)** to turn the index bins into rate zones; see [Zone Rx prescriptions](/fieldagent-documentation-updates/export-and-share/zone-rx-prescriptions.md).
* **Between flights,** the same indices are available from satellite; see [Satellite imagery](/fieldagent-documentation-updates/analytics/satellite-imagery.md).
## Related pages
* [Order a mosaic](/fieldagent-documentation-updates/ordering/order-a-mosaic.md)
* [QuickTiles and mosaics](/fieldagent-documentation-updates/imagery/quicktiles-and-mosaics.md)
* [Elevation Mosaic](/fieldagent-documentation-updates/analytics/elevation-mosaic.md)