> For the complete documentation index, see [llms.txt](https://support.senterasensors.com/fieldagent-documentation-updates/llms.txt). Markdown versions of documentation pages are available by appending `.md` to page URLs; this page is available as [Markdown](https://support.senterasensors.com/fieldagent-documentation-updates/analytics/elevation-mosaic.md).
# Elevation Mosaic
Order an Elevation Mosaic in FieldAgent Web, read the surface model with the colorization controls, and export it.
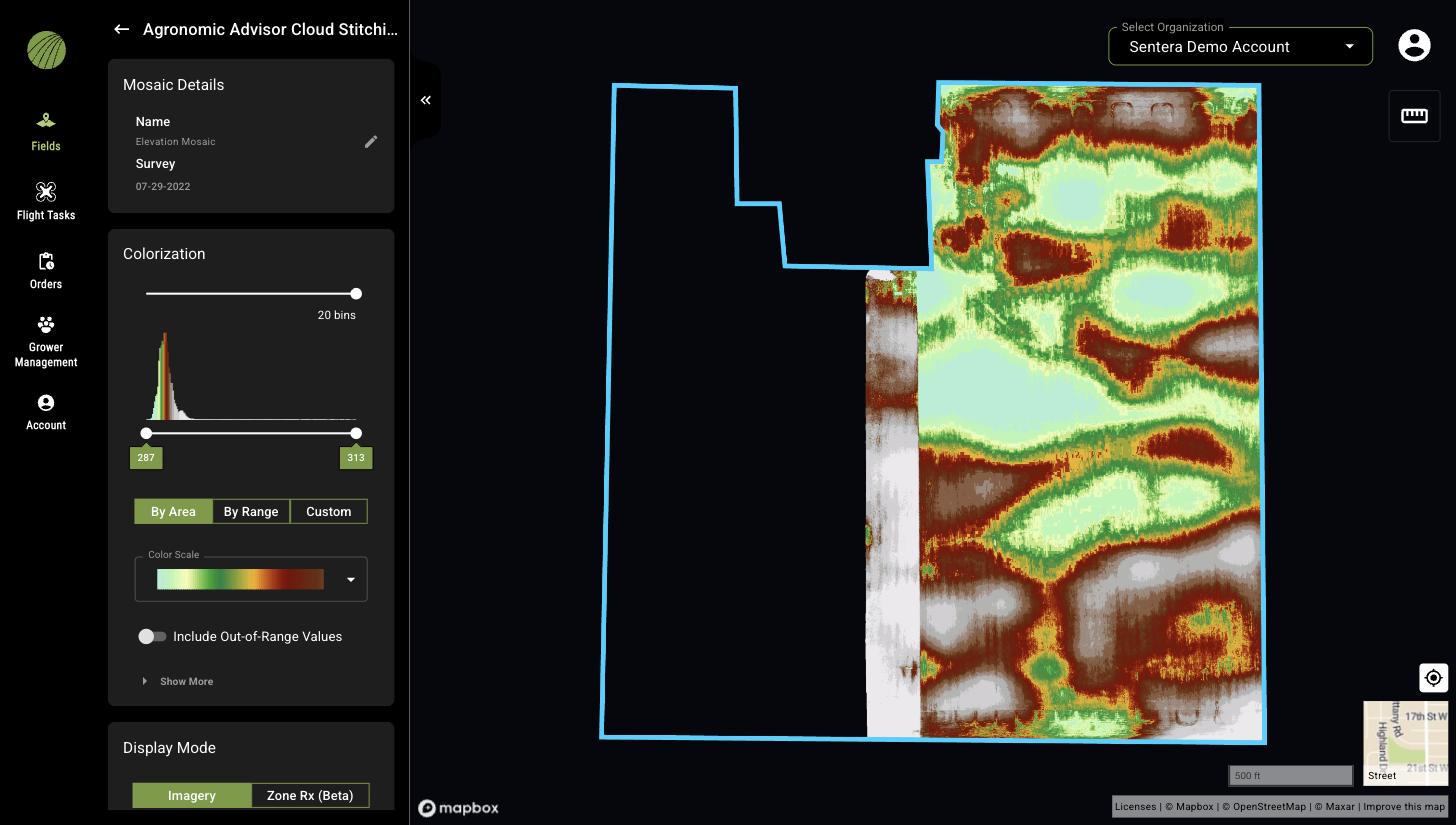
An **Elevation Mosaic** is a digital surface model of the field built from the same photos as an RGB mosaic. Each pixel holds the elevation of the surface the camera saw, so the layer shows low spots that pond, ridges, drainage paths, and the lay of terraces.
The Elevation Mosaic is included in every plan.
The demo below is a working, view-only copy of FieldAgent Web with the steps for adding and reading the Elevation Mosaic. Follow them in the copy, or press **Show me** to watch each one.
{% @fieldagent-demo/embed content="elevation" %}
Open this demo full size
## Order
The elevation mosaic is ordered together with an RGB mosaic. Click **ORDER MOSAICS**, select the survey, select **RGB and Elevation Mosaics**, and click **SUBMIT**. The **Order Summary** shows **Elevation Map 71309-02**. See [Order a mosaic](/fieldagent-documentation-updates/ordering/order-a-mosaic.md).
Elevation needs good photo overlap. Fly the survey with the overlap the catalog specifies for mosaics, at a consistent altitude, on a day with steady light.
## View
1. Open the field, click the layers icon in **Map Layers**, and under the survey date turn on **Elevation Mosaic**.
2. Click the layer name to open **Mosaic Details** and **Colorization**.
3. Adjust the bins and range. The histogram shows how the elevations are distributed; dragging the range handles toward the low end isolates the lowest ground in the field.
An Elevation Mosaic. The range handles show the lowest and highest elevations in the field.
The colorization controls are the same as for any other index layer; see [Colorization and visualization](/fieldagent-documentation-updates/view-and-analyze/colorization-and-visualization.md).
## Use it
* Lower the layer's **Opacity** over an RGB mosaic or NDVI layer to relate wet or weak areas to the terrain.
* Draw a zone over a suspected low area and read its statistics in **Zone Statistics**.
* Switch **Display Mode** to **Zone Rx (Beta)** to convert elevation bins into zones, for example to build a drainage or seeding prescription; see [Zone Rx prescriptions](/fieldagent-documentation-updates/export-and-share/zone-rx-prescriptions.md).
* Download the mosaic from **Download Files** for use in GIS or drainage-design software; see [Download and export data](/fieldagent-documentation-updates/export-and-share/download-and-export-data.md).
## Related pages
* [Elevation and hydrology](/fieldagent-documentation-updates/analytics/elevation-and-hydrology.md) — contour lines, flow lines and depressions from a bare-soil flight
* [Order a mosaic](/fieldagent-documentation-updates/ordering/order-a-mosaic.md)
* [Crop Health mosaics](/fieldagent-documentation-updates/analytics/crop-health-mosaics.md)