> For the complete documentation index, see [llms.txt](https://support.senterasensors.com/fieldagent-documentation-updates/llms.txt). Markdown versions of documentation pages are available by appending `.md` to page URLs; this page is available as [Markdown](https://support.senterasensors.com/fieldagent-documentation-updates/analytics/satellite-imagery.md).
# Satellite imagery
View Sentinel-2 NDVI, NDRE, and RGB satellite layers on any field in FieldAgent Web, pick cloud-free dates, and use them between drone flights.
Every field in FieldAgent has a running series of satellite scenes from the Sentinel-2 constellation, operated by the European Space Agency. No flight or order is needed. At 10 meters per pixel the scenes are far coarser than drone imagery, but they arrive every few days all season, which makes them the tool for watching a field between flights and deciding where to fly or walk next.
Satellite imagery is included in every plan.
The demo below is a working, view-only copy of FieldAgent Web with the steps for adding a satellite scene. Follow them in the copy, or press **Show me** to watch each one.
{% @fieldagent-demo/embed content="satellite" %}
Open this demo full size
## Add a satellite layer
1. Open the field and click the layers icon in the **Map Layers** card.
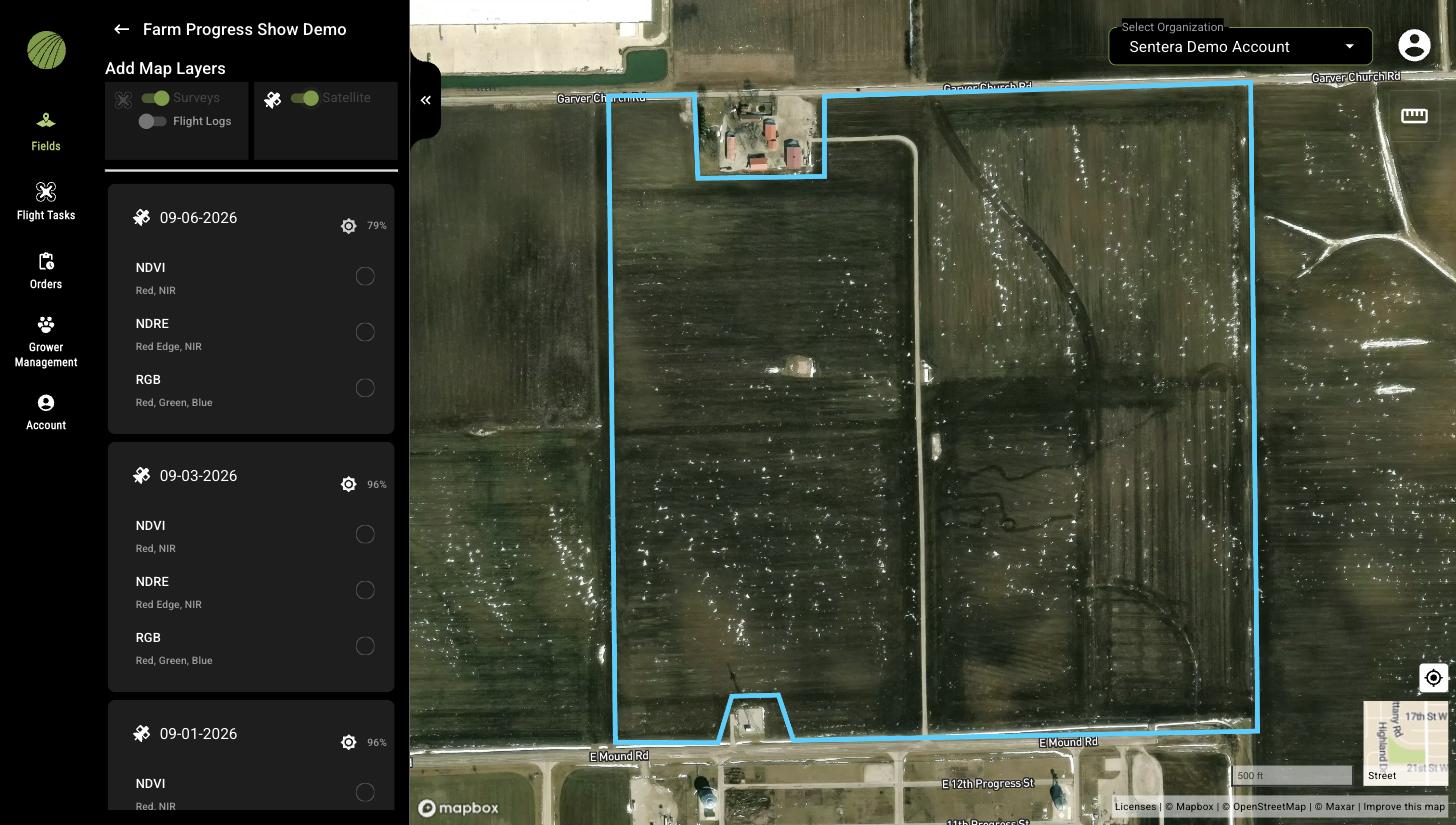
2. In **Add Map Layers**, turn on the **Satellite** switch. Turn off **Surveys** if you want to see only satellite dates.
3. Each date lists three layers: **NDVI** (Red, NIR), **NDRE** (Red Edge, NIR), and **RGB** (Red, Green, Blue). The sun icon and percentage next to the date indicate how clear the sky was; pick dates with high percentages. Click the circle next to a layer to show it.
4. Click the arrow at the top of the panel to return to the field view.
Satellite scenes are listed by date with a clear-sky percentage.
## Read a satellite layer
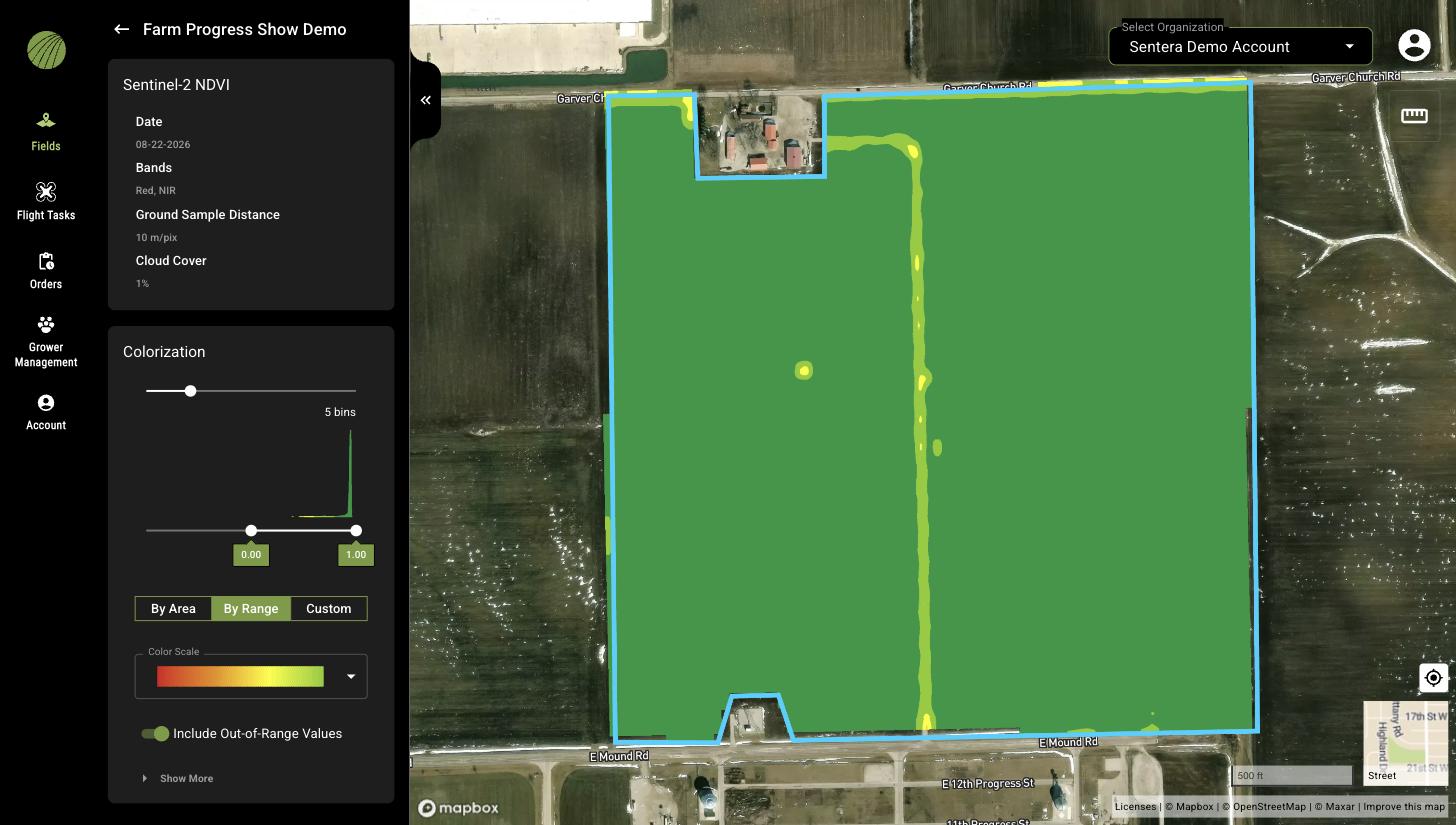
Click the layer name in **Map Layers** to open its details. **Sentinel-2 NDVI** (or NDRE) shows the scene's **Date**, **Bands**, **Ground Sample Distance** (10 m/pix), and **Cloud Cover**, followed by the same **Colorization** controls as a drone layer. The layer is clipped to the field boundary, so the histogram and the zone statistics describe only the field.
A Sentinel-2 NDVI scene. Cloud Cover confirms the scene is usable.
Clouds and cloud shadows read as low index values. Before trusting a low patch, open the same date's **RGB** layer to see whether it is cloud or crop.
## Use satellite imagery
* **Monitor between flights.** Add the most recent clear NDVI scene each week. A field that is greening up evenly needs no visit; an area that falls behind is where to fly or walk.
* **Track the season with zone statistics.** With **By Range** colorization and the field-boundary **Average** in **Zone Statistics**, the same layer type across dates shows the crop's development and, late in the season, its dry-down. See [Zones and zone statistics](/fieldagent-documentation-updates/view-and-analyze/zones-and-zone-statistics.md).
* **Compare areas.** Draw zones over hybrids or practices and compare their averages on a clear scene.
* **Build a prescription.** Switch **Display Mode** to **Zone Rx (Beta)** on an NDVI or NDRE scene to turn it into rate zones; see [Zone Rx prescriptions](/fieldagent-documentation-updates/export-and-share/zone-rx-prescriptions.md).
Satellite layers work with the same display tools as drone layers: stack them, reorder them, hide them, and change their **Opacity**.
## Related pages
* [Map layers](/fieldagent-documentation-updates/view-and-analyze/map-layers.md)
* [Colorization and visualization](/fieldagent-documentation-updates/view-and-analyze/colorization-and-visualization.md)
* [Crop Health mosaics](/fieldagent-documentation-updates/analytics/crop-health-mosaics.md)