> For the complete documentation index, see [llms.txt](https://support.senterasensors.com/fieldagent-documentation-updates/llms.txt). Markdown versions of documentation pages are available by appending `.md` to page URLs; this page is available as [Markdown](https://support.senterasensors.com/fieldagent-documentation-updates/analytics/stand-count.md).
# Stand Count
Order a Field Scale Stand Count in FieldAgent Web, read plant density on the map, check individual samples with the validator box, exclude bad samples, compare zones, and download the results.
A stand count measures emerged plants per acre from low-altitude photos taken across the field. FieldAgent counts the plants in each photo and returns two layers: **Stand Count - Individual** (one labeled dot per sample photo) and a **Stand Count Heatmap** that interpolates the samples across the field.
Stand Count is included in the Advisor and Advanced plans. **Stand Count with Uniformity** and **Stand Count and Weed Pressure (Beta)** are Advanced products ordered the same way.
The demo below is a working, view-only copy of FieldAgent Web on a real stand-count field from the Sentera Demo Account: 41 counted photos, the heatmap, the individual samples and the sample viewer. Follow the steps in the copy, or press **Show me** to watch each one.
{% @fieldagent-demo/embed content="stand-count" %}
Open this demo full size
## Fly and order
1. Plan a stand count flight in FieldAgent Mobile with the flight specification from the product's catalog page, and fly it after emergence, before the plants overlap in the row.
2. Import the photos into the field; see [Import imagery in FieldAgent Web](/fieldagent-documentation-updates/imagery/import-imagery-in-fieldagent-web.md).
3. Click **ORDER ANALYTICS**, choose **Field Scale Stand Count**, select the survey, and enter the **Crop Type** (Corn, Cotton, or Soybean), **Seeding Rate**, and **Row Spacing**. Click **SUBMIT**. See [Order analytics](/fieldagent-documentation-updates/ordering/order-analytics.md).
FieldAgent emails you when the count is ready. Field-scale stand counts usually process in under an hour.
## Read the results
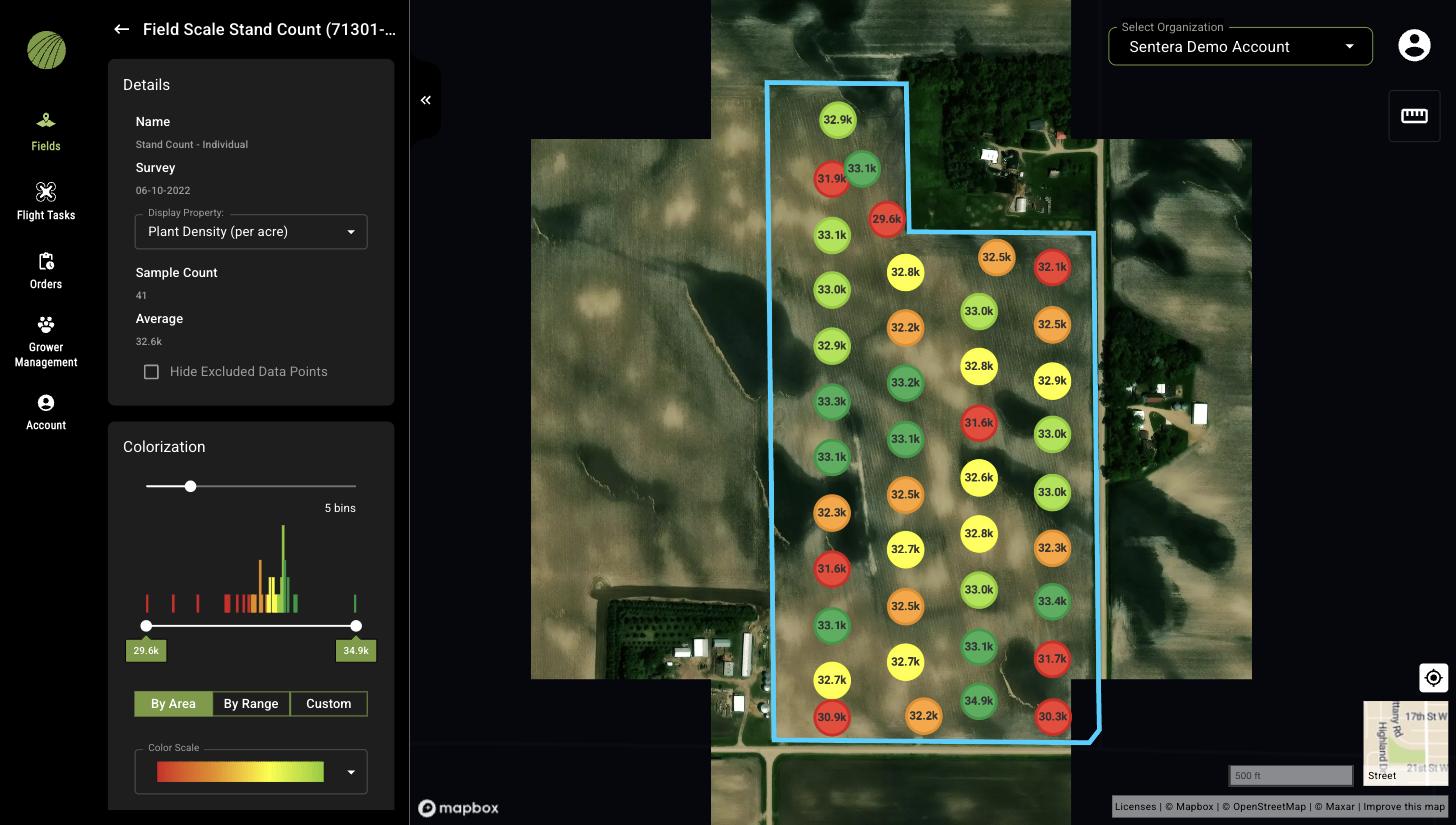
Open the field, click the layers icon in **Map Layers**, and under the survey date turn on **Stand Count - Individual**. Each dot is a sample photo labeled with its plant density, colored from red (lowest) to green (highest). Click the layer name to open its details.
A stand count with 41 samples averaging 32.6k plants per acre.
| Panel item | Meaning |
| ----------------------------- | ---------------------------------------------------------------------------------------------------------------------------------------------------------------------- |
| **Display Property** | The value shown on the dots: **Plant Density (per acre)** or **Emergence (%)**, the density as a share of the seeding rate you entered. |
| **Sample Count** | How many photos were counted. |
| **Average** | The mean of the samples that are not excluded. |
| **Hide Excluded Data Points** | Removes excluded samples from the map. |
| **Colorization** | Bins, range, and color scale for the dots; see [Colorization and visualization](/fieldagent-documentation-updates/view-and-analyze/colorization-and-visualization.md). |
| **Zone Statistics** | **Minimum**, **Average**, and **Maximum** density for the field boundary and each zone. |
| **Download Files** | **GeoJSON**, **CSV**, and **Shapefile** of the samples. |
Turn on the **Stand Count Heatmap** from the same survey to see the density interpolated across the whole field.
## Check a sample
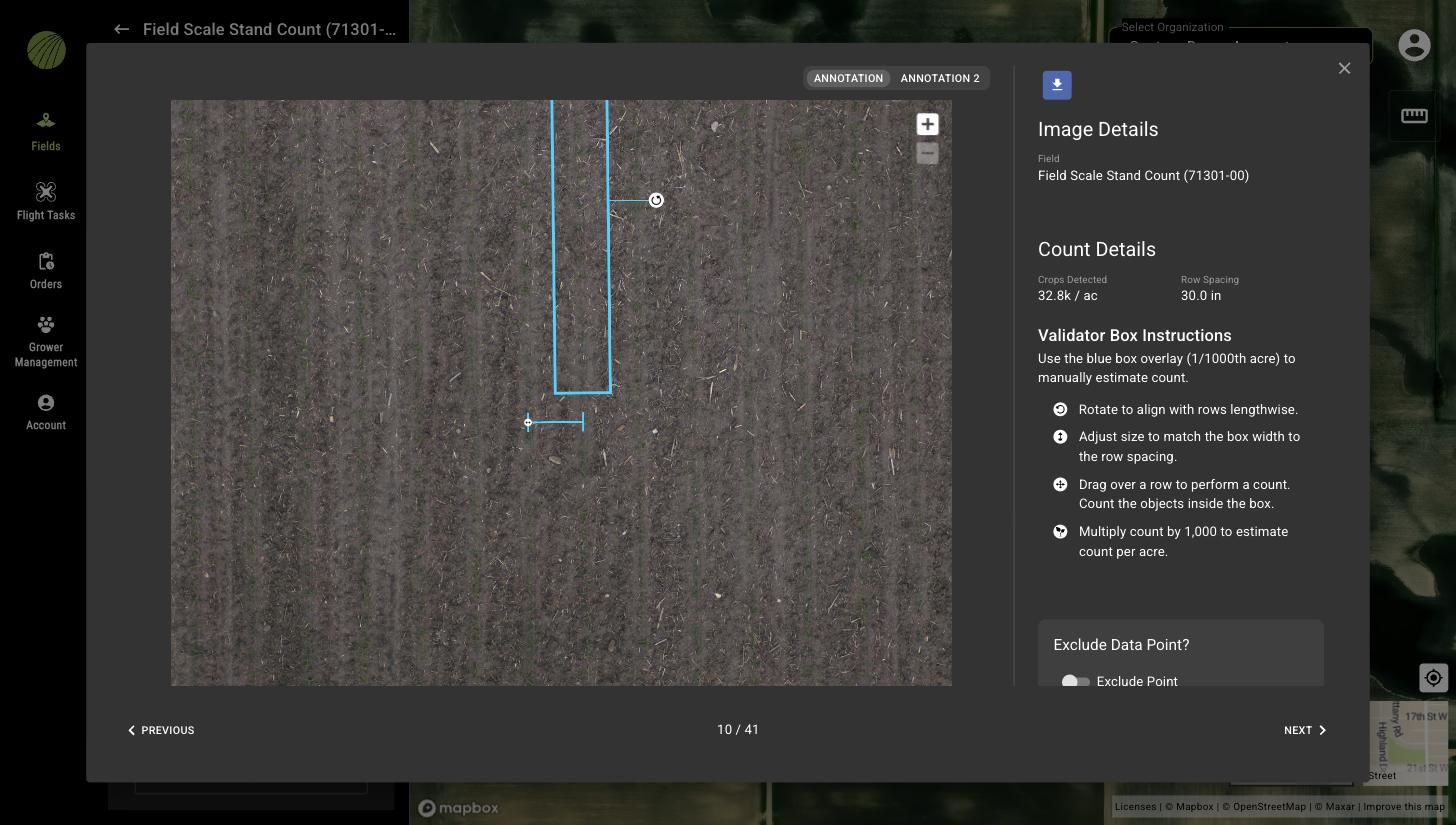
Click a dot to open the sample in the image viewer.
Checking a sample with the validator box.
* **ANNOTATION** and **ANNOTATION 2** switch between the annotation views: the photo with the validator box, and the photo with the rows FieldAgent found and every plant it counted marked.
* **Count Details** gives the **Crops Detected** for this photo and the **Row Spacing** you entered.
* The **Validator Box** is a blue box covering 1/1000 of an acre. Rotate it to align with the rows, adjust its width to the row spacing, drag it over a row, count the plants inside it, and multiply by 1,000 for a manual density estimate to compare with **Crops Detected**.
* **EXCLUDE DATA POINT?** removes the sample from the average and the zone statistics, for example a photo over an end row or a waterway. Excluded points can be hidden with **Hide Excluded Data Points** in the layer details.
* **PREVIOUS** and **NEXT** step through the samples in order; the counter shows which of the samples you are on.
## Compare areas of the field
Draw a zone over each hybrid, planter pass, or treatment and read the **Zone Statistics** in the layer details; see [Zones and zone statistics](/fieldagent-documentation-updates/view-and-analyze/zones-and-zone-statistics.md). Setting the colorization to two bins by area also splits the field visually into the better and worse halves.
## Export
**Download Files** at the bottom of the layer details provides the samples as **GeoJSON**, **CSV**, and **Shapefile**. The **Stand Count Heatmap** can be turned into a variable-rate prescription with **Zone Rx (Beta)**; see [Zone Rx prescriptions](/fieldagent-documentation-updates/export-and-share/zone-rx-prescriptions.md). For a PDF, see [Create a report](/fieldagent-documentation-updates/export-and-share/create-a-report.md).
## Related pages
* [Order analytics](/fieldagent-documentation-updates/ordering/order-analytics.md)
* [Tassel Count and yield estimate](/fieldagent-documentation-updates/analytics/tassel-count.md)
* [Download and export data](/fieldagent-documentation-updates/export-and-share/download-and-export-data.md)