> For the complete documentation index, see [llms.txt](https://support.senterasensors.com/fieldagent-documentation-updates/llms.txt). Markdown versions of documentation pages are available by appending `.md` to page URLs; this page is available as [Markdown](https://support.senterasensors.com/fieldagent-documentation-updates/export-and-share/zone-rx-prescriptions.md).
# Zone Rx prescriptions
Turn a colorized layer into management zones with the Zone Rx (Beta) display mode in FieldAgent Web, set a rate per zone, download the prescription, or send it to John Deere Operations Center.
**Zone Rx (Beta)** is a display mode on index layers that groups the layer's colorization bins into zones and lets you assign a rate to each zone. The result can be downloaded as a prescription file or sent to John Deere Operations Center.
Zone Rx works on any layer that has values, including NDVI and NDRE mosaics, satellite scenes, the **Stand Count Heatmap**, the **Tassel Count Heatmap**, and the **Elevation Mosaic**. It does not work on RGB layers, which have no single value per pixel.
## Build the zones
1. Turn on the layer and click its name in **Map Layers** to open its details.
2. In **Colorization**, set the number of bins to the number of zones you want, and set the breaks with **By Area**, **By Range**, or **Custom**. Each bin becomes one zone. See [Colorization and visualization](/fieldagent-documentation-updates/view-and-analyze/colorization-and-visualization.md).
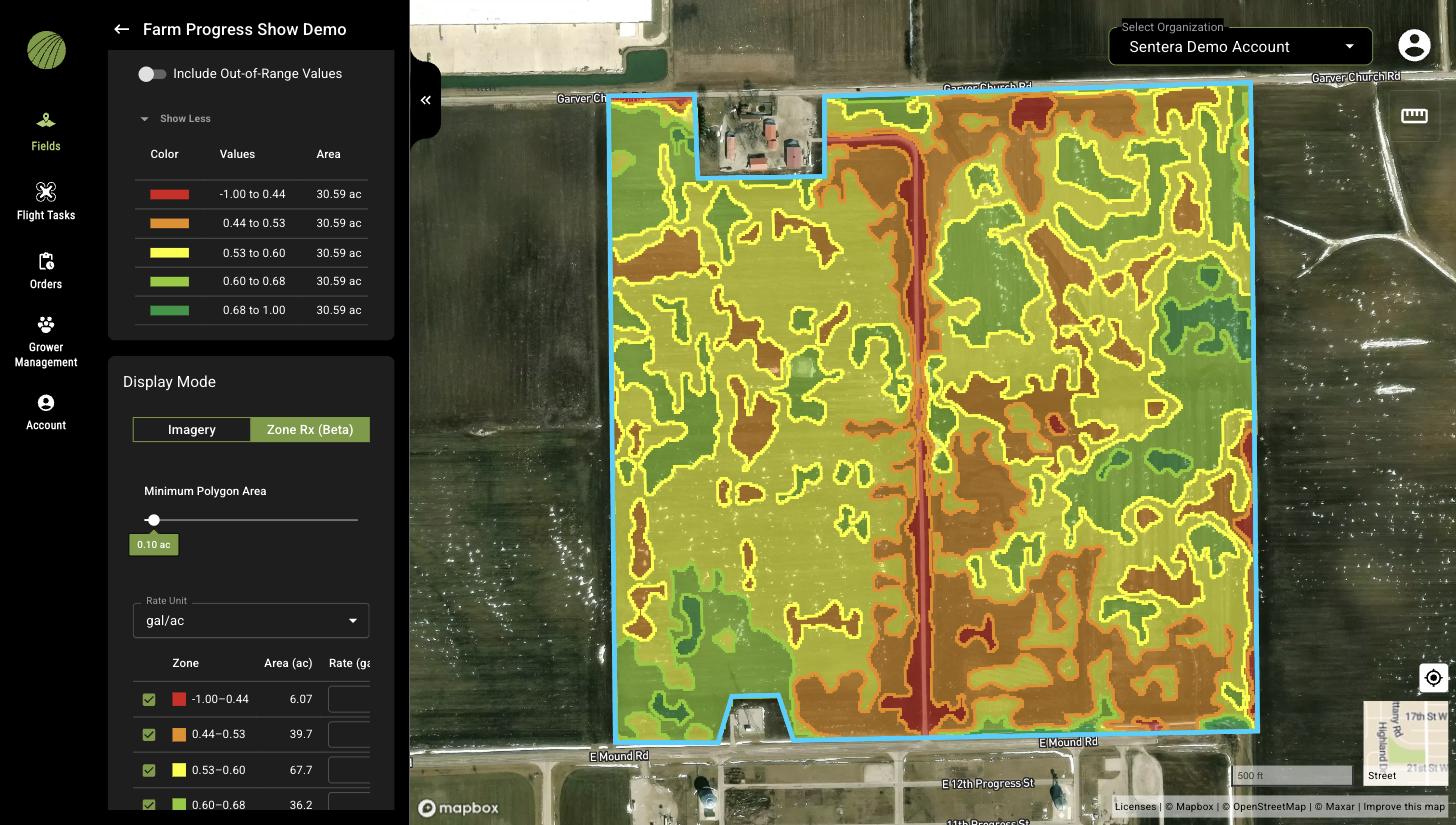
3. In **Display Mode**, select **Zone Rx (Beta)**. The map redraws as zone outlines and the prescription controls appear.
4. Set **Minimum Polygon Area**. Zones smaller than this are merged into their neighbors, which removes specks a machine cannot follow. The default is 0.10 ac.
Zone Rx (Beta) on an NDVI layer with five bins.
## Set the rates
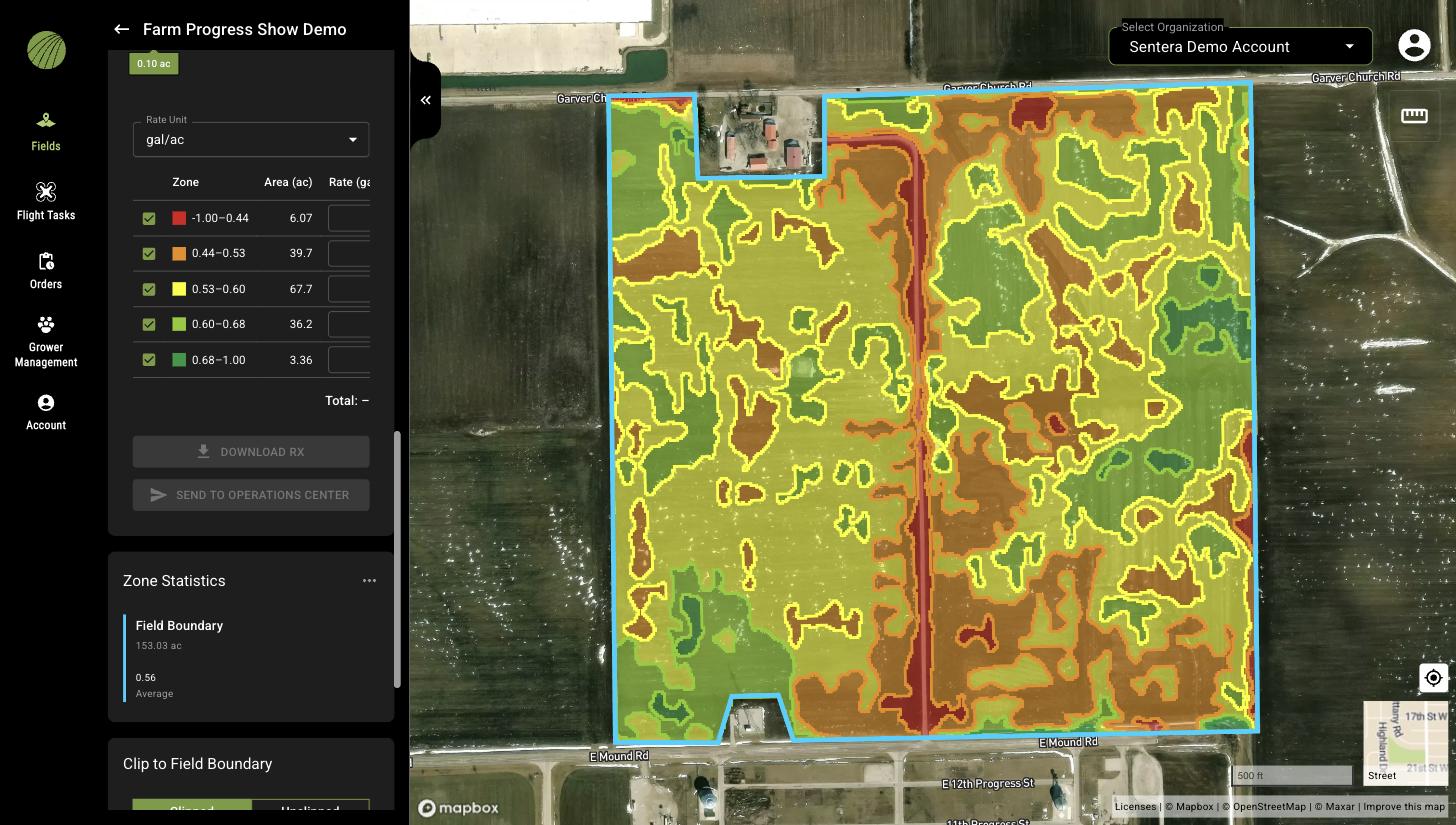
1. Choose the **Rate Unit**, for example **gal/ac**.
2. In the zone table, each row is one zone with its color, value range, and **Area (ac)**. Enter the **Rate** for each zone. Clear a zone's checkbox to leave it out of the prescription.
3. The **Total** under the table adds up the product for the whole field.
The rate table. Enter a rate for each zone to enable the download and send buttons.
## Download or send the prescription
* **DOWNLOAD RX** downloads the prescription file for use in your farm management or machine software.
* **SEND TO OPERATIONS CENTER** sends the prescription to the John Deere Operations Center account connected under **Account** › **Connections**. See [Account settings](/fieldagent-documentation-updates/account-and-organizations/account-settings.md) for connecting an account.
Both buttons are disabled until rates have been entered.
## Tips
* **Clip to Field Boundary** set to **Clipped** keeps the prescription inside the boundary.
* To treat only the weakest part of the field, colorize with one bin and drag the upper range handle down before switching to **Zone Rx (Beta)**; the single zone covers only that area.
* Zone Rx zones are computed from the layer and are separate from the zones you draw by hand in the **Zones** card.
## Related pages
* [Colorization and visualization](/fieldagent-documentation-updates/view-and-analyze/colorization-and-visualization.md)
* [Zones and zone statistics](/fieldagent-documentation-updates/view-and-analyze/zones-and-zone-statistics.md)
* [Download and export data](/fieldagent-documentation-updates/export-and-share/download-and-export-data.md)