> For the complete documentation index, see [llms.txt](https://support.senterasensors.com/fieldagent-documentation-updates/llms.txt). Markdown versions of documentation pages are available by appending `.md` to page URLs; this page is available as [Markdown](https://support.senterasensors.com/fieldagent-documentation-updates/view-and-analyze/colorization-and-visualization.md).
# Colorization and visualization
Choose the index or band a multispectral mosaic shows, and use the Colorization controls (bins, range, By Area, By Range, Custom, color scale, color table) to bring out the pattern you are looking for
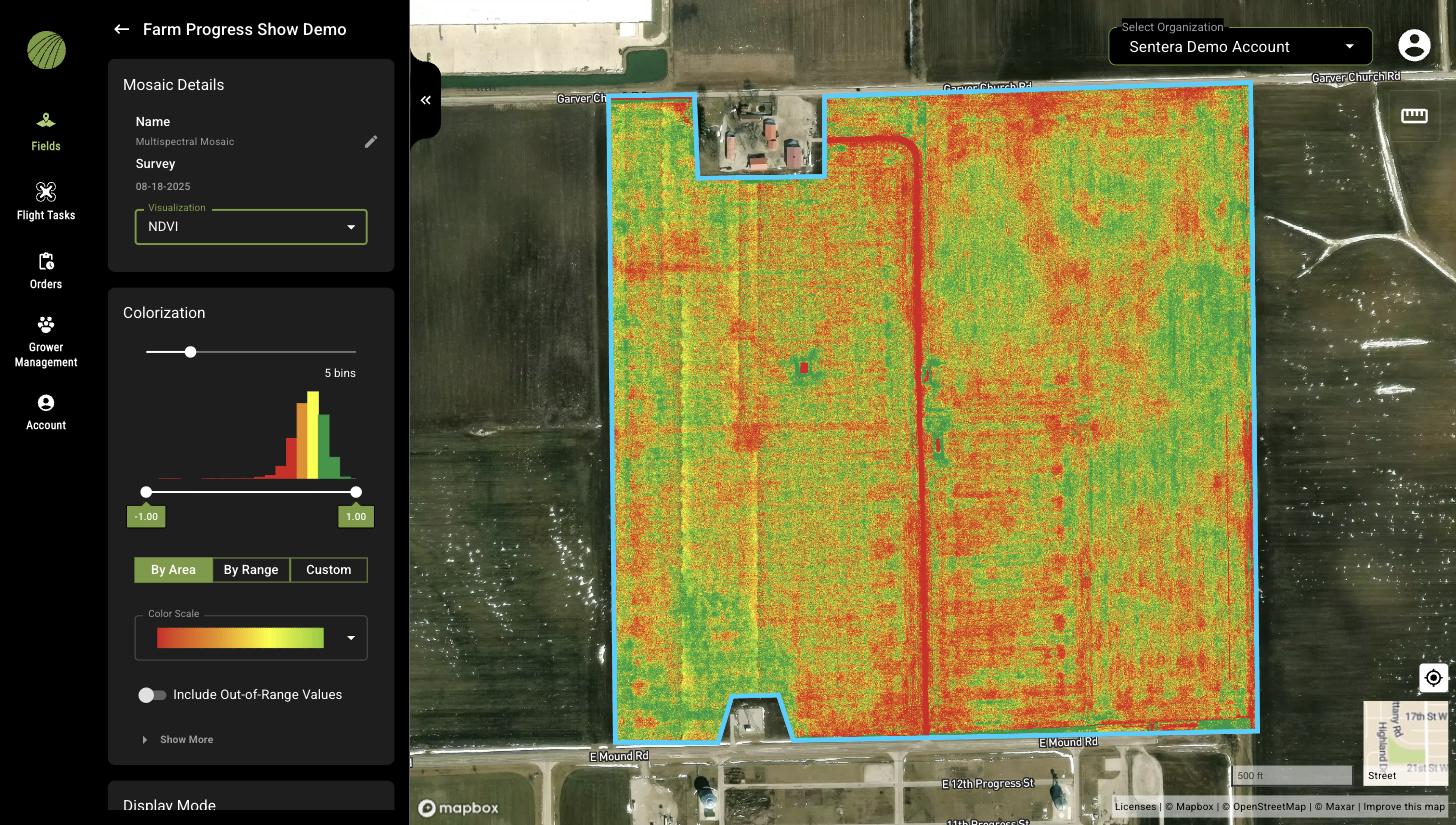
Index layers such as NDVI, elevation, stand count, and tassel count are numbers on a map. The **Colorization** section of the layer details decides how those numbers become colors. The same controls appear on drone mosaics, satellite scenes, and analytics, so what you learn here applies everywhere.
The demo below is a working, view-only copy of FieldAgent Web with the colorization controls on an NDVI layer. Follow the steps in the copy, or press **Show me** to watch each one.
{% @fieldagent-demo/embed content="colorization" %}
Open this demo full size
## Choose what a multispectral mosaic shows
A **Multispectral Mosaic** stores every band the sensor captured, so one layer can be viewed many ways. In **Mosaic Details**, the **Visualization** selector switches between the indices and bands available for that mosaic, such as **NDVI** and **NDRE**. The colorization controls update for the selected visualization. See [Crop Health mosaics](/fieldagent-documentation-updates/analytics/crop-health-mosaics.md) for what each index shows.
NDVI on a multispectral mosaic, colorized in five bins by area.
## The Colorization controls
| Control | What it does |
| ------------------------------- | -------------------------------------------------------------------------------------------------------------------------------------------------------------------------------------------------------------------- |
| Bins slider | Sets how many colors the values are divided into, from 1 to 20. Fewer bins make a simpler map that shows the broad pattern; more bins show more detail. |
| Histogram | Shows how the layer's values are distributed. Each bar is colored with the bin it falls in, so you can see where the breaks are. |
| Range sliders | Set the lowest and highest values that are colored. Values outside the range are not drawn unless **Include Out-of-Range Values** is on. Drag the handles, or read the current limits in the boxes under the slider. |
| **By Area** | Sets the bin breaks so that each color covers the same area of the field. Good for seeing the best and worst parts of one layer. |
| **By Range** | Sets the bin breaks at equal value intervals. Good for comparing layers from different dates or different fields, because the same value always gets the same color. |
| **Custom** | Lets you set the break values yourself. |
| **Color Scale** | Chooses the color ramp. The default runs from red (low) through yellow to green (high). |
| **Include Out-of-Range Values** | When on, values below the range take the lowest color and values above it take the highest, so the whole layer stays visible. |
| **Show More** | Expands the color table: for each bin, its **Color**, the range of **Values** it covers, and the **Area** of the field in that bin. |
The color table under **Show More** is the quickest way to put a number on what you see: for example, how many acres of the field fall in the lowest NDVI bin.
## Common settings
| To | Set |
| --------------------------------------------- | ----------------------------------------------------------------------------------------------------------------------- |
| Find the weakest part of the field | 1 bin, drag the upper range handle down until only the low values are colored, and read the **Area** in the color table |
| Find the strongest part of the field | 1 bin, drag the lower range handle up |
| Compare two flights of the same field | **By Range** with the same bins and range on both layers |
| Split the field into three management classes | 3 bins, **By Area** or **Custom** breaks, then switch **Display Mode** to **Zone Rx (Beta)** |
The **Zone Rx (Beta)** display mode uses the bins you set here to build its zones, so set the colorization first and then switch display modes.
## Related pages
* [Map layers](/fieldagent-documentation-updates/view-and-analyze/map-layers.md)
* [Zones and zone statistics](/fieldagent-documentation-updates/view-and-analyze/zones-and-zone-statistics.md)
* [Zone Rx prescriptions](/fieldagent-documentation-updates/export-and-share/zone-rx-prescriptions.md)