> For the complete documentation index, see [llms.txt](https://support.senterasensors.com/fieldagent-documentation-updates/llms.txt). Markdown versions of documentation pages are available by appending `.md` to page URLs; this page is available as [Markdown](https://support.senterasensors.com/fieldagent-documentation-updates/view-and-analyze/map-layers.md).

# Map layers

Add surveys, satellite scenes, and flight logs to the map in FieldAgent Web, stack and reorder layers, hide or remove them, and open a layer's details.

Everything you can see on a field's map is a layer: a QuickTile, a mosaic, an analytic such as a stand count, a set of photo dots, a satellite scene, or a flight log. The **Map Layers** card in the field view lists the layers currently shown; **Add Map Layers** is where you turn layers on.

The demo below is a working, view-only copy of FieldAgent Web with the steps for adding, hiding and opening layers. Follow them in the copy, or press **Show me** to watch each one.

{% @fieldagent-demo/embed content="map-layers" %}

<a href="https://michael-bohman.github.io/fieldagent-demo/demo.html?s=map-layers&#x26;mode=page" class="button secondary">Open this demo full size</a>

## Add a layer

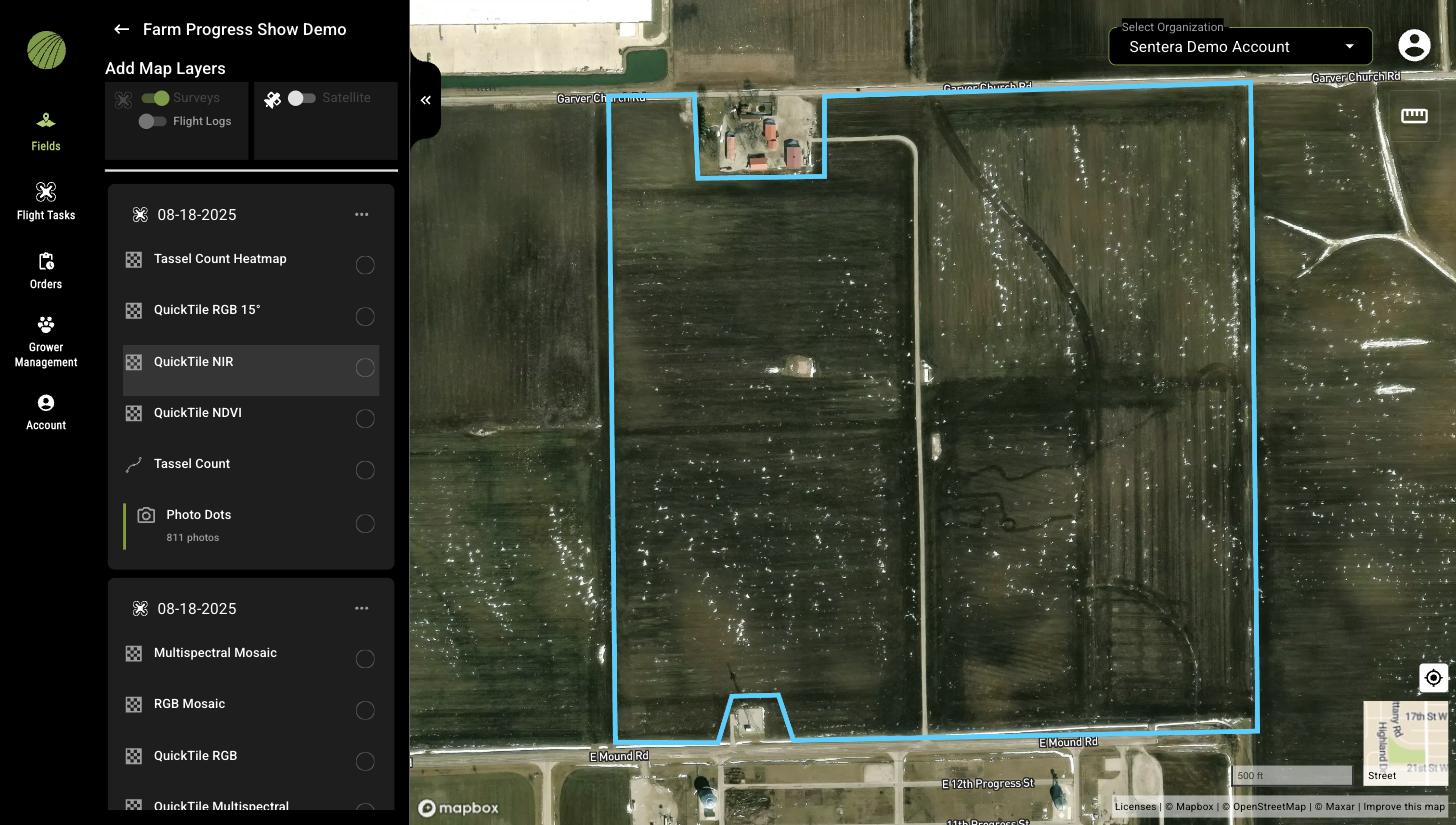
1. Open the field and click the layers icon in the **Map Layers** card (or **Click here to add a map layer** when no layer is shown yet). The **Add Map Layers** panel opens.
2. Use the switches at the top to choose what the panel lists: **Surveys** (drone imagery and analytics, grouped by flight date), **Satellite** (Sentinel-2 scenes, grouped by date), and **Flight Logs**.
3. Scroll to the date you want and click the circle next to a layer to show it on the map. You can turn on several layers, from the same survey or from different dates.
4. Click the arrow at the top of the panel to return to the field view. The layers you turned on are listed in the **Map Layers** card.

<figure><img src="https://4042936416-files.gitbook.io/~/files/v0/b/gitbook-x-prod.appspot.com/o/spaces%2FNnNa4XKy1hMfEEmHLPqZ%2Fuploads%2Fgit-blob-d4e94048a1cf9483231b9a40e68c4a3933e96955%2Ffa-web-add-map-layers.jpg?alt=media" alt="The Add Map Layers panel with the Surveys switch on, showing two surveys dated 08-18-2025 with Tassel Count Heatmap, QuickTile RGB, QuickTile NIR, QuickTile NDVI, Tassel Count, Photo Dots, Multispectral Mosaic, and RGB Mosaic layers"><figcaption><p>Add Map Layers. Each survey is a flight date; the layers under it are what that survey produced.</p></figcaption></figure>

A survey lists everything produced from that flight: **Photo Dots** with the number of photos, the automatic **QuickTile** layers, and any mosaics or analytics you ordered, such as **RGB Mosaic**, **Multispectral Mosaic**, **Tassel Count**, or **Tassel Count Heatmap**. The menu next to a survey date offers **Edit Name**, **Edit Notes**, and **Delete**.

## Work with the layers on the map

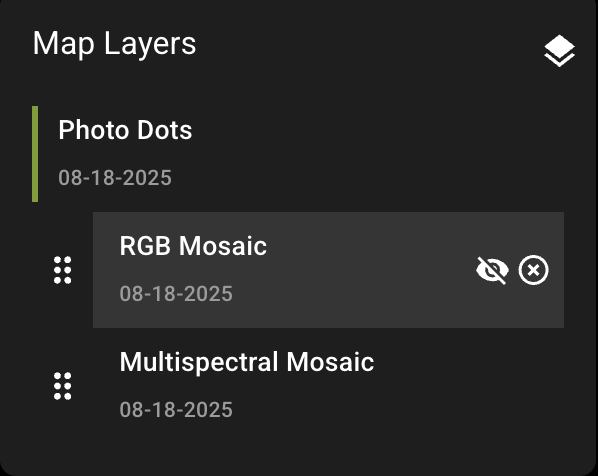
In the **Map Layers** card, hover over a layer to see its controls.

<figure><img src="https://4042936416-files.gitbook.io/~/files/v0/b/gitbook-x-prod.appspot.com/o/spaces%2FNnNa4XKy1hMfEEmHLPqZ%2Fuploads%2Fgit-blob-938adb2d73f7a5829798a6aaaed9e28a07c52734%2Ffa-web-map-layers-hover-icons.png?alt=media" alt="The Map Layers card listing Photo Dots, RGB Mosaic, and Multispectral Mosaic, with the hide and remove icons shown on the hovered RGB Mosaic layer and drag handles on the left"><figcaption><p>Hover over a layer to hide or remove it; drag the handle to reorder.</p></figcaption></figure>

| Control                        | What it does                                                                                                               |
| ------------------------------ | -------------------------------------------------------------------------------------------------------------------------- |
| Drag handle (dots on the left) | Drag a layer up or down. Layers higher in the list draw on top of layers below them.                                       |
| Eye icon                       | Hides the layer without removing it. Click again to show it.                                                               |
| X icon                         | Removes the layer from the map. The data is not deleted; add it again from **Add Map Layers**.                             |
| Layer name                     | Opens the layer's details panel, where you colorize it, read zone statistics, download its data, and create prescriptions. |

To compare two dates, turn on both layers, open the upper one, and lower its **Opacity**, or hide and show it with the eye icon.

## The layer details panel

Clicking a layer's name replaces the field view with the details for that layer. The panel differs by layer type, but most layers have these sections:

| Section                           | Contents                                                                                                                                                                                                             |
| --------------------------------- | -------------------------------------------------------------------------------------------------------------------------------------------------------------------------------------------------------------------- |
| **Mosaic Details** or **Details** | The layer's **Name** (the pencil renames it), the **Survey** date, and for a multispectral mosaic the **Visualization** selector. Analytics show a **Display Property** selector, **Sample Count**, and **Average**. |
| **Colorization**                  | Bins, histogram, value range, binning method, color scale, and the color table. See [Colorization and visualization](/fieldagent-documentation-updates/view-and-analyze/colorization-and-visualization.md).          |
| **Display Mode**                  | **Imagery** shows the layer as pixels; **Zone Rx (Beta)** groups it into zones for a prescription. See [Zone Rx prescriptions](/fieldagent-documentation-updates/export-and-share/zone-rx-prescriptions.md).         |
| **Opacity**                       | Fades the layer so layers or the basemap underneath show through.                                                                                                                                                    |
| **Zone Statistics**               | The layer's values inside the field boundary and inside each zone. See [Zones and zone statistics](/fieldagent-documentation-updates/view-and-analyze/zones-and-zone-statistics.md).                                 |
| **Clip to Field Boundary**        | **Clipped** hides the parts of the layer outside the boundary; **Unclipped** shows the whole layer.                                                                                                                  |
| **Download Files**                | Downloads of the layer's data. See [Download and export data](/fieldagent-documentation-updates/export-and-share/download-and-export-data.md).                                                                       |
| **DELETE**                        | Deletes the layer from the field.                                                                                                                                                                                    |

The arrow at the top of the panel returns to the field view.

## Related pages

* [Colorization and visualization](/fieldagent-documentation-updates/view-and-analyze/colorization-and-visualization.md)
* [Photo dots and the image viewer](/fieldagent-documentation-updates/view-and-analyze/photo-dots-and-image-viewer.md)
* [Satellite imagery](/fieldagent-documentation-updates/analytics/satellite-imagery.md)