> For the complete documentation index, see [llms.txt](https://support.senterasensors.com/fieldagent-documentation-updates/llms.txt). Markdown versions of documentation pages are available by appending `.md` to page URLs; this page is available as [Markdown](https://support.senterasensors.com/fieldagent-documentation-updates/view-and-analyze/zones-and-zone-statistics.md).
# Zones and zone statistics
Draw zones inside a field in FieldAgent Web, read the minimum, average, and maximum of any layer inside each zone, and download zone boundaries.
A zone is a shape drawn inside a field: a hybrid strip, a treatment block, a wet spot, an area you want to watch. Once a zone exists, every layer's details panel reports that layer's values inside it, which turns a visual impression into numbers you can compare.
The **Zones** card in the field view lists the **Field Boundary** and every zone with its area.
The demo below is a working, view-only copy of FieldAgent Web with the steps for turning zones on and reading zone statistics. Follow them in the copy, or press **Show me** to watch each one.
{% @fieldagent-demo/embed content="zones" %}
Open this demo full size
## Draw a zone
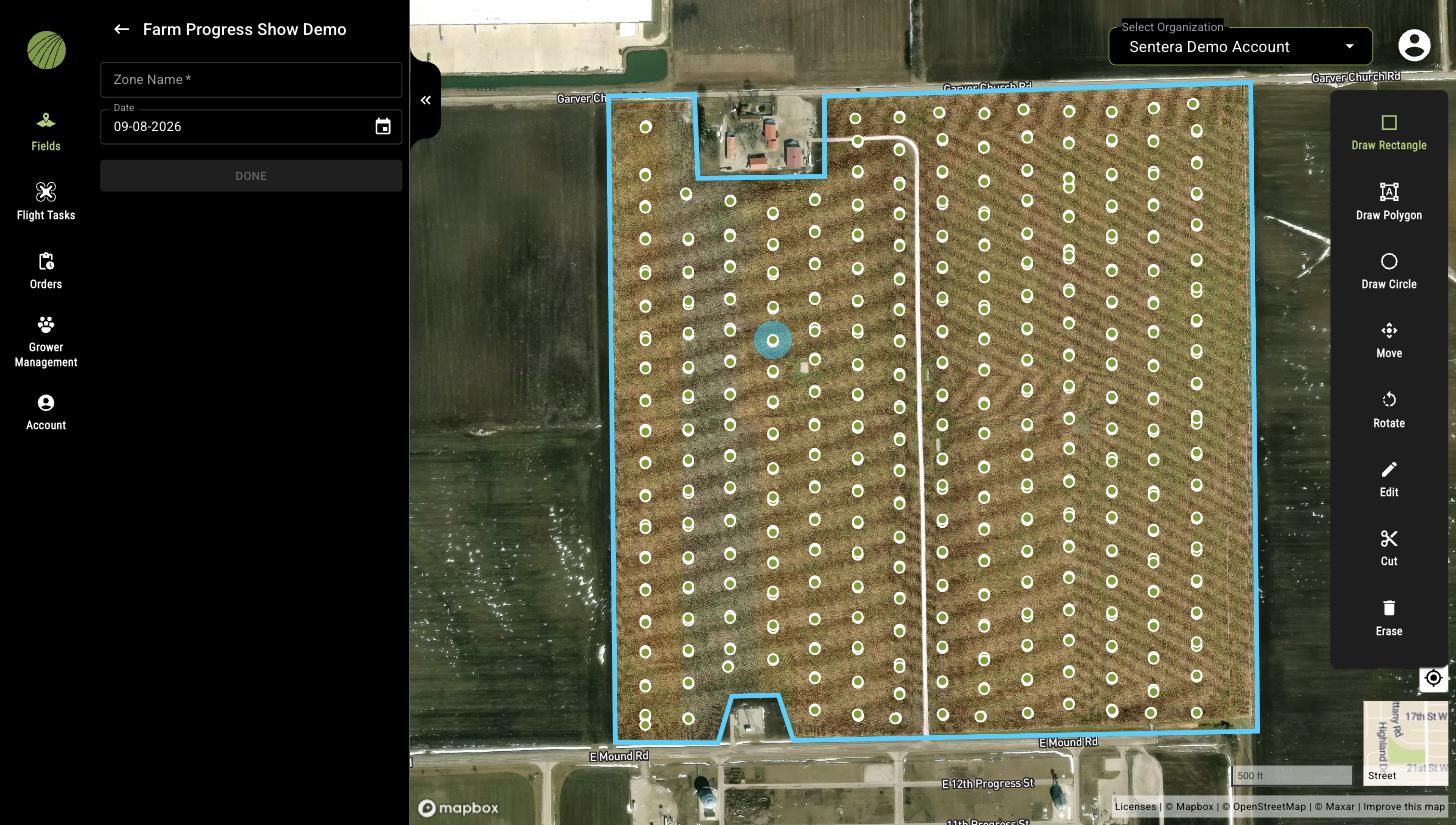
1. Open the field and click the plus icon in the **Zones** card. The zone form and the drawing tools open.
2. Enter a **Zone Name** and, if the zone belongs to a particular date, set the **Date**.
3. Draw the shape with **Draw Rectangle**, **Draw Polygon**, or **Draw Circle**, and adjust it with **Move**, **Rotate**, **Edit**, **Cut**, and **Erase**. The tools work the same way as when drawing a field boundary; see [Create a field](/fieldagent-documentation-updates/fields/create-a-field.md#drawing-tools). Turning on a layer before you start makes it easier to trace the area you care about.
4. Click **DONE**.
Drawing a new zone.
The zone appears in the **Zones** card under the field boundary.
## Read zone statistics
1. Turn on the layer you want numbers for and click its name in the **Map Layers** card to open its details.
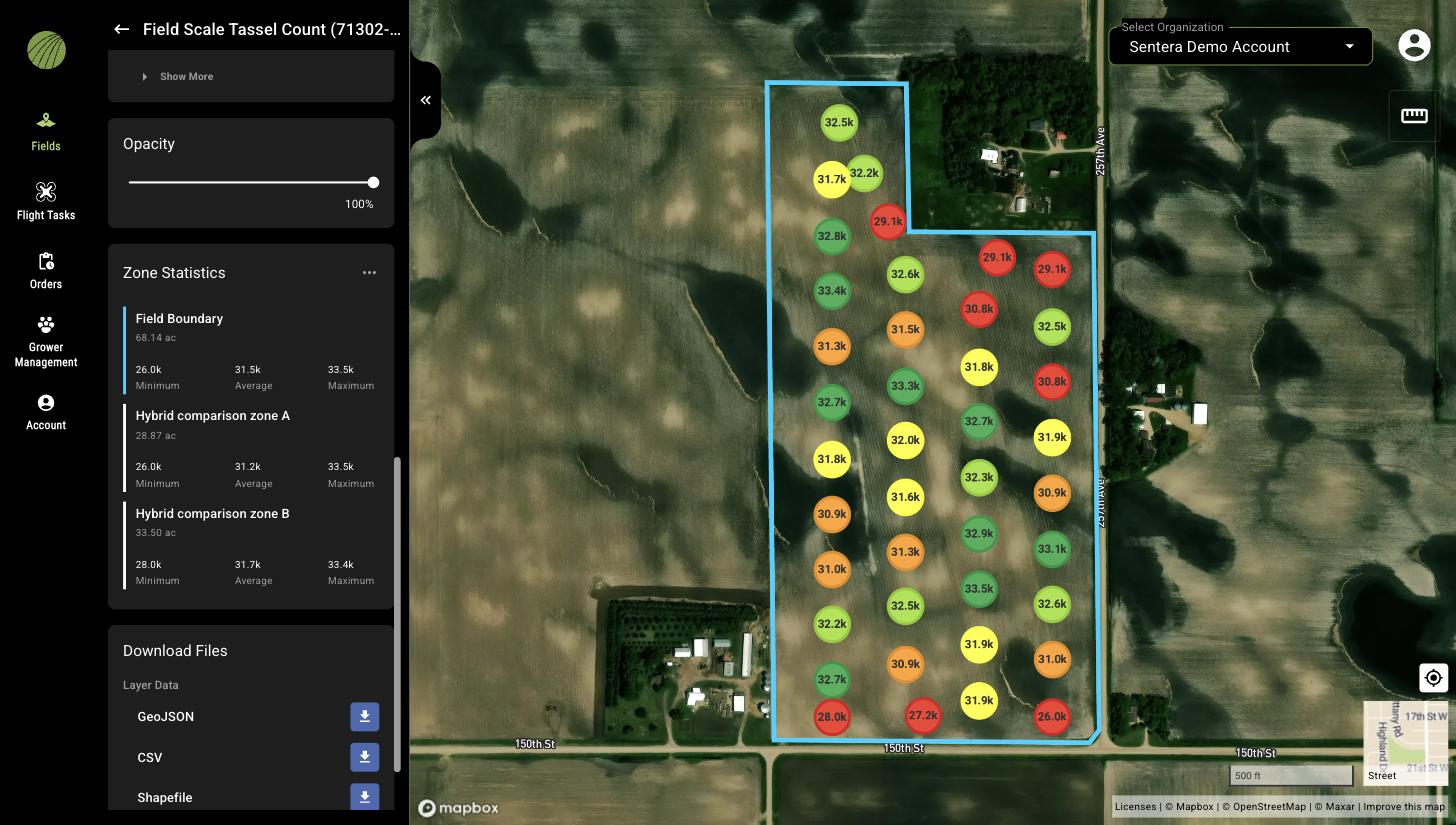
2. Scroll to **Zone Statistics**. The **Field Boundary** entry gives the value for the whole field; each zone below it gives the value inside that zone.
Zone Statistics on a Tassel Count layer comparing two hybrid zones.
For stand counts and tassel counts, each zone shows the **Minimum**, **Average**, and **Maximum** of the samples inside it. For index layers such as NDVI, NDRE, and satellite scenes, each zone shows its **Average** value.
Zone statistics work across dates. Open the same zone on a satellite NDVI layer from each week of the season, and the field-boundary average charts the crop's dry-down.
## Download zone boundaries
The menu (three dots) on the **Zones** card downloads the field boundary and zones as **GeoJSON**, **Shapefile**, **CSV**, or **KML** for use in other software.
## Zones and prescriptions
Zones drawn by hand are for comparison. To split a field into rate zones from a layer's values, use the **Zone Rx (Beta)** display mode instead; see [Zone Rx prescriptions](/fieldagent-documentation-updates/export-and-share/zone-rx-prescriptions.md).
## Related pages
* [Map layers](/fieldagent-documentation-updates/view-and-analyze/map-layers.md)
* [Colorization and visualization](/fieldagent-documentation-updates/view-and-analyze/colorization-and-visualization.md)
* [Download and export data](/fieldagent-documentation-updates/export-and-share/download-and-export-data.md)