# Create and Export Management Zones and Prescription Files
**Now available for satellite imagery!**
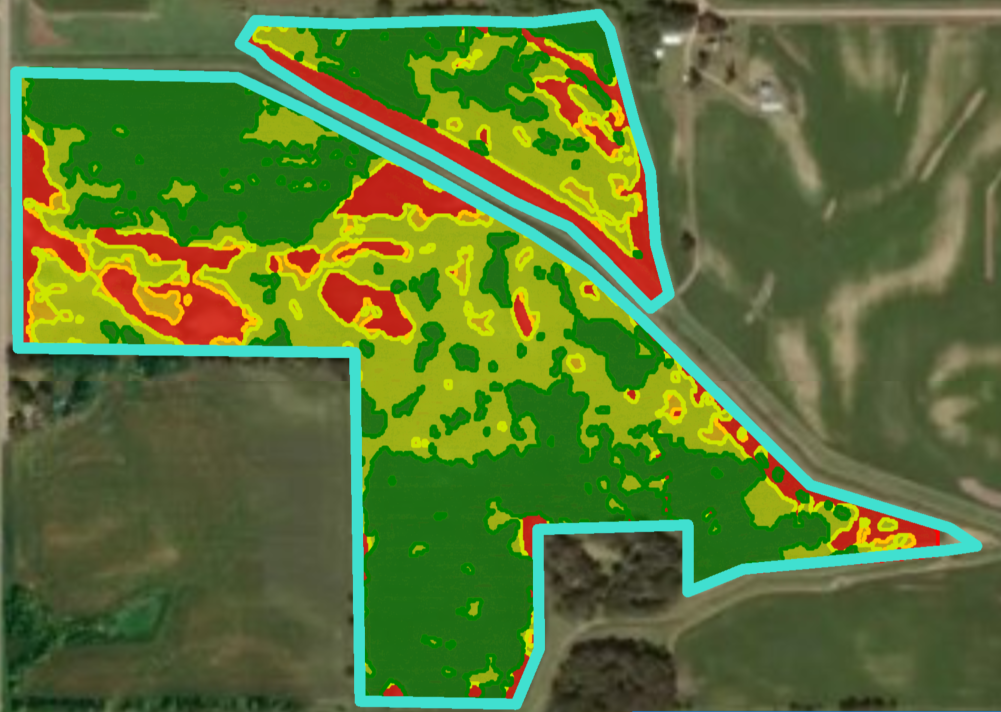
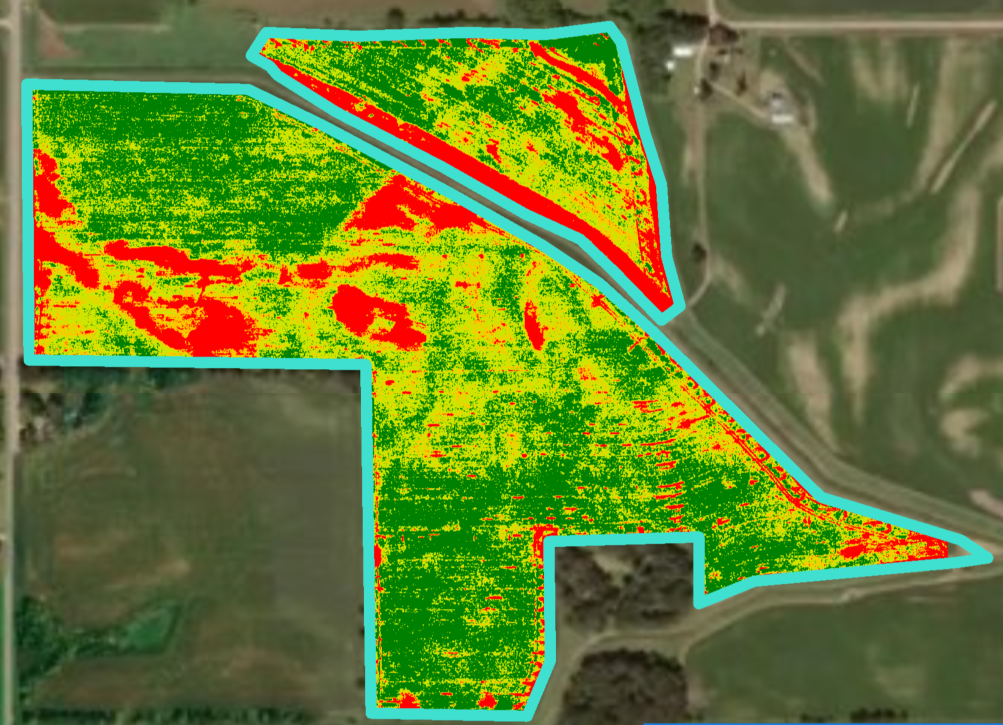
Management zones are used to group the data of a detailed health map into simple shapes that can then be exported as a prescription file. Below is an example of a zone map (left) and the health map which was used to create the management zone.\
\
### Management Zones on Web
1. Open [FieldAgent.Sentera.com](http://fieldagent.sentera.com/) and [navigate to the field](fieldagent/fieldagent-web/navigating-to-a-field) you'd like to create a zone map for.
2. Open the map layer you'd like to create the zone map from. Note: RGB layers cannot be turned into zone maps.
Some types of map layers that can be turned into zone maps include:
* NDVI or NDRE Satellite Imagery
* NDVI or NDRE QuickTiles or Mosaics
* Populations Maps (from a Stand Count)
* Tassel Maps (from a Tassel Count)
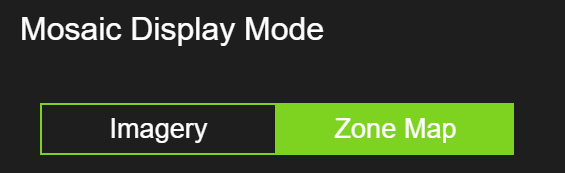
3. Set the mosaic display mode to Zone map\
4. [Manipulate the layer](how-to-manipulate-map-layers) as you'd like:
* Select the number of bins (colors)
* Set the minimum and maximum values to be included
5. Click Download Shapefile\

The downloaded file can now be used in a tool such as SMS to create a prescription.
### Management Zones on Desktop
To create management zones and subsequent prescription file:
1. Open FieldAgent on your Desktop.
2. Navigate to the field you’d like to create a prescription for.
3. Select the layer you’d like to create a prescription from.
4. Select the Toolbox.
5. Select the Gears icon.
6. A popup window will indicate loading status. Note that this process may take some time.
7. A prescription can then be created. Re-open the toolbox and select the RX icon.
8. Set the units and rate at which the file should be written for.
### Area Isolation Example
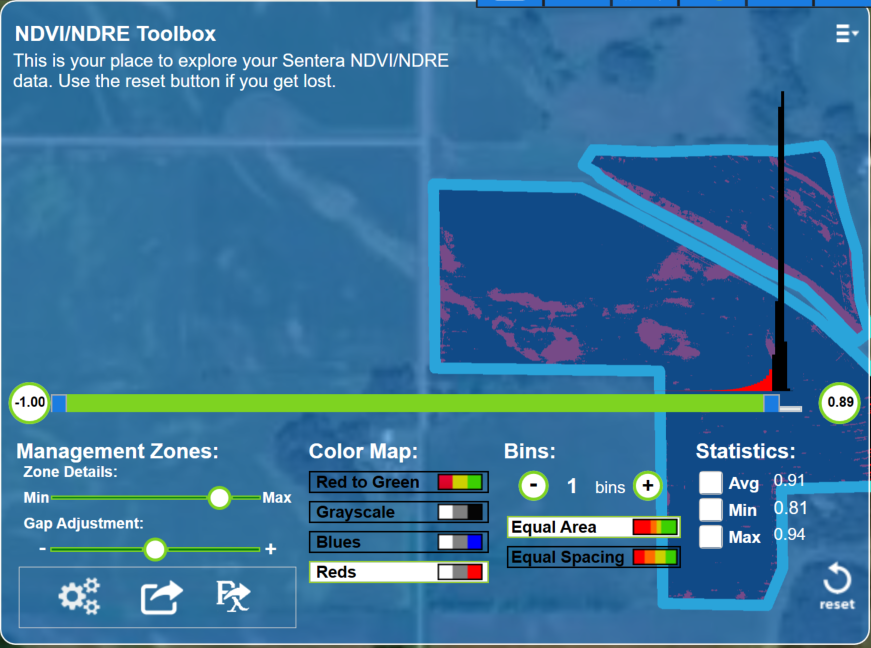
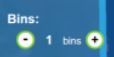
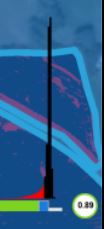
To write a prescription for only the worst or best areas of a field use the toolbox to manipulate the dataset before running the management zone tool. Isolate a specific part of the field by setting the bins to 1 and then drag the min and max sliders around on the graph.
Settings for this example:
1. Bins were set to 1\
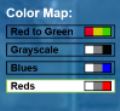
2. Color Map set to Reds\
3. Max slider moved to the left\
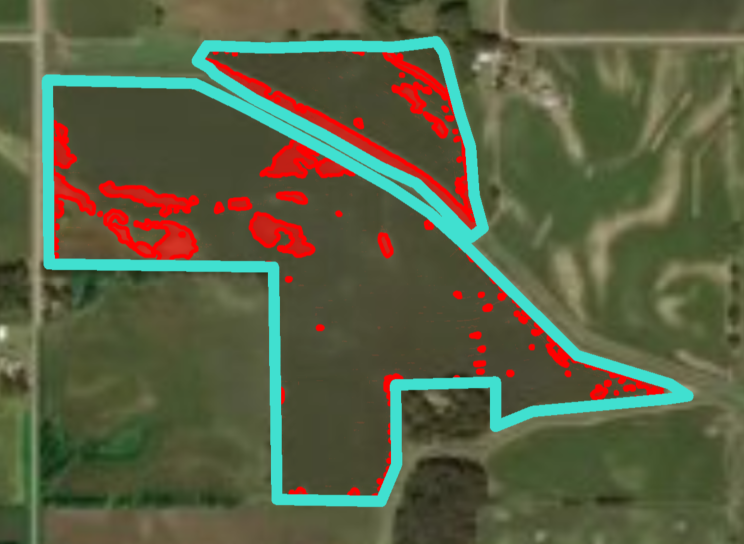
4. Generate a management zone by pressing the gear icon in the toolbox
In this case, the worst performing areas of the field were isolated for treatment.
 **Now available for satellite imagery!**
Management zones are used to group the data of a detailed health map into simple shapes that can then be exported as a prescription file. Below is an example of a zone map (left) and the health map which was used to create the management zone.\
\

### Management Zones on Web
1. Open [FieldAgent.Sentera.com](http://fieldagent.sentera.com/) and [navigate to the field](fieldagent/fieldagent-web/navigating-to-a-field) you'd like to create a zone map for.
2. Open the map layer you'd like to create the zone map from. Note: RGB layers cannot be turned into zone maps.
Some types of map layers that can be turned into zone maps include:
* NDVI or NDRE Satellite Imagery
* NDVI or NDRE QuickTiles or Mosaics
* Populations Maps (from a Stand Count)
* Tassel Maps (from a Tassel Count)
3. Set the mosaic display mode to Zone map\

4. [Manipulate the layer](how-to-manipulate-map-layers) as you'd like:
* Select the number of bins (colors)
* Set the minimum and maximum values to be included
5. Click Download Shapefile\

The downloaded file can now be used in a tool such as SMS to create a prescription.
### Management Zones on Desktop
To create management zones and subsequent prescription file:
1. Open FieldAgent on your Desktop.
2. Navigate to the field you’d like to create a prescription for.
3. Select the layer you’d like to create a prescription from.
4. Select the Toolbox.
5. Select the Gears icon.
6. A popup window will indicate loading status. Note that this process may take some time.
**Now available for satellite imagery!**
Management zones are used to group the data of a detailed health map into simple shapes that can then be exported as a prescription file. Below is an example of a zone map (left) and the health map which was used to create the management zone.\
\

### Management Zones on Web
1. Open [FieldAgent.Sentera.com](http://fieldagent.sentera.com/) and [navigate to the field](fieldagent/fieldagent-web/navigating-to-a-field) you'd like to create a zone map for.
2. Open the map layer you'd like to create the zone map from. Note: RGB layers cannot be turned into zone maps.
Some types of map layers that can be turned into zone maps include:
* NDVI or NDRE Satellite Imagery
* NDVI or NDRE QuickTiles or Mosaics
* Populations Maps (from a Stand Count)
* Tassel Maps (from a Tassel Count)
3. Set the mosaic display mode to Zone map\

4. [Manipulate the layer](how-to-manipulate-map-layers) as you'd like:
* Select the number of bins (colors)
* Set the minimum and maximum values to be included
5. Click Download Shapefile\

The downloaded file can now be used in a tool such as SMS to create a prescription.
### Management Zones on Desktop
To create management zones and subsequent prescription file:
1. Open FieldAgent on your Desktop.
2. Navigate to the field you’d like to create a prescription for.
3. Select the layer you’d like to create a prescription from.
4. Select the Toolbox.
5. Select the Gears icon.
6. A popup window will indicate loading status. Note that this process may take some time.