> For the complete documentation index, see [llms.txt](https://support.senterasensors.com/home/llms.txt). Markdown versions of documentation pages are available by appending `.md` to page URLs; this page is available as [Markdown](https://support.senterasensors.com/home/fieldagent/how-to-manipulate-map-layers.md).
# How to Manipulate Map Layers
## FieldAgent Web
### Selecting a Map Layer
1\. [Navigate to the field](/home/fieldagent/fieldagent/fieldagent-web/navigating-to-a-field.md) where you would like to view a map layer.\
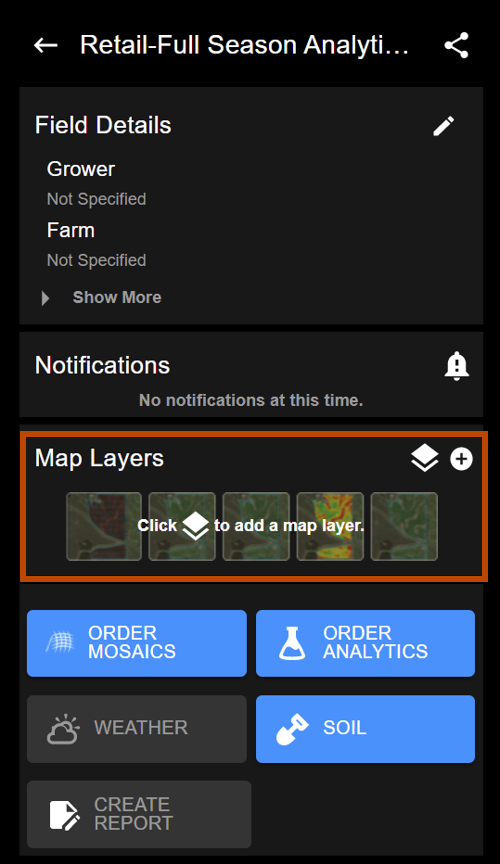
2\. Select the map layers icon in the Map Layers section on the left.
\
\
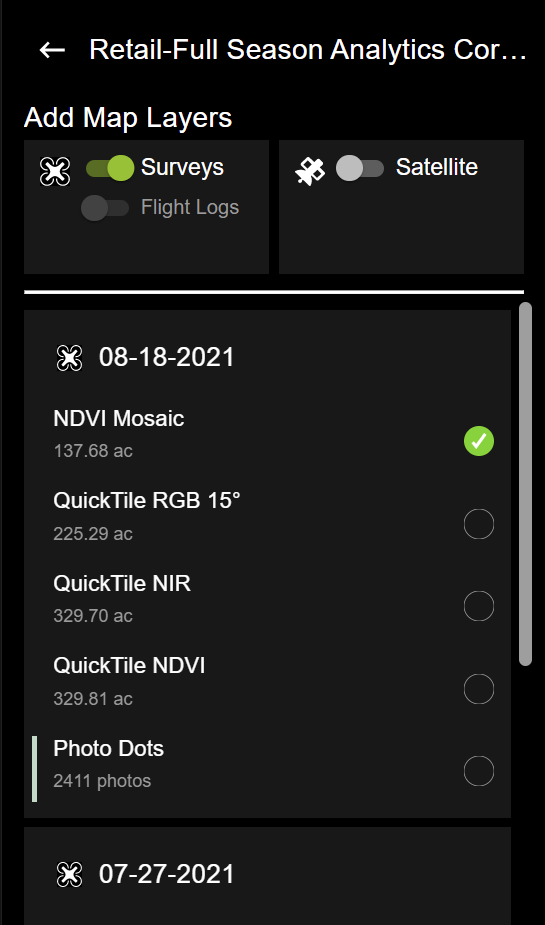
3\. Locate and select the map layer you'd like to view.\
\
\
4\. Click on a selected map layer to view the map details page.\
\
This page provides options for editing how the map layer is displayed:\
\
\
On the Map Details page, you'll see sections on the left for various ways to manipulate your map layer:
* Mosaic Details: Name/date of the survey. Click the pencil icon to edit the name of the map layer.
* Mosaic Display Mode: Select "imagery" (standard map layer) or "zone map" (groups pixels to highlight trends). Note: RGB map layers do not have display mode options.
* Colorization: Change the values of how the histogram are displayed based on bins, max/min sliders, color scale, equal area, or equal spacing.
* Numbers of bins changes how many colors the values of the graph are divided into (the more colors, the more detail)
* Max/min sliders change which pixels are included in the colorization (this can be used to highlight specific areas of a field)
* Color scale changes which colors are used in visualizing the map (our default is red to green, so the lowest values are in red and highest values are in green)
* Equal area gives each color the same number of pixels on the field (e.g., see best or worst areas of a simple map layer)
* Equal spacing sets spacing by color and colors pixels as they fall into these intervals (e.g., compare map layers from day-to-day or across different regions)
* Clip to Field Boundary: Constrains the displayed image to the field boundary
* Opacity: Option to lower the opacity to see through the select map layer so you can compare multiple map layers at once
* Download Files: Download the data in the format of your choice (available options are listed in the bottom left-hand column)
## FieldAgent Desktop
When it comes to manipulating map layers, there are a few features in FieldAgent Desktop that are not available in FieldAgent Web. See below how to use this functionality in FieldAgent Desktop.
1. Open Field View tab, then click Field Boundary, select the survey, and then select the Full Mosaic.
2. Select the NDVI/NDRE Toolbox from the field window.
3. Use the slide bars within the window similar to the functionality in FieldAgent Web, such as Color Map, Bins, Value, Equal Area.
4. To view statistics, select a shape file, then within the Statistics area, select average, minimum, and maximum values.\ **Note:** The statistics numbers may vary due to the numbers within the toolbox reflect the entire field, in the field reflect the statistics within the shape.
5\. To create a management zone, adjust the Zone Details and Gap Adjustments if necessary, then click the gear icon to generate zones.\
6\. To export the management zones as a shape file, click the Export icon. The file can then be imported into a farm management tool.
## Standard Examples for Manipulating Map Layers
### Highlight the Best Area
1. Bins: 1
2. Min/Max: Minimum slider moved to the right
3. Color Scale: Red to green
Click show more under the slider to view the highlighted number of acres (or the best area in the field).
### Highlight the Worst Area
* Bins: 1
* Min/Max: Maximum slider moved to the left.
* Color Scale: White to red
### Highlight/Contrast the Best vs. Worst Areas
1. Display Mode: Zone Map
2. Bins: 2
3. Area Type: Equal Area
4. Color Scale: Red to green
Need further assistance on this topic? Check out our video on YouTube:
{% embed url="" %}
---
# Agent Instructions
This documentation is published with GitBook. GitBook is the documentation platform designed so that both humans and AI agents can read, navigate, and reason over technical content effectively. Learn more at gitbook.com.
## Querying This Documentation
If you need additional information that is not directly available in this page, you can query the documentation dynamically by asking a question.
Perform an HTTP GET request on the current page URL with the `ask` query parameter, and the optional `goal` query parameter:
```
GET https://support.senterasensors.com/home/fieldagent/how-to-manipulate-map-layers.md?ask=&goal=
```
`ask` is the immediate question: it should be specific, self-contained, and written in natural language.
`goal` is optional and describes the broader end goal you are ultimately trying to accomplish on behalf of the user. GitBook uses it to tailor the answer towards what is most useful for that goal.
The response will contain a direct answer to the question and relevant excerpts and sources from the documentation.
Use this mechanism when the answer is not explicitly present in the current page, you need clarification or additional context, or you want to retrieve related documentation sections.
 **Note:** The statistics numbers may vary due to the numbers within the toolbox reflect the entire field, in the field reflect the statistics within the shape.
5\. To create a management zone, adjust the Zone Details and Gap Adjustments if necessary, then click the gear icon to generate zones.\
6\. To export the management zones as a shape file, click the Export icon. The file can then be imported into a farm management tool.
## Standard Examples for Manipulating Map Layers
### Highlight the Best Area
1. Bins: 1
2. Min/Max: Minimum slider moved to the right
3. Color Scale: Red to green
**Note:** The statistics numbers may vary due to the numbers within the toolbox reflect the entire field, in the field reflect the statistics within the shape.
5\. To create a management zone, adjust the Zone Details and Gap Adjustments if necessary, then click the gear icon to generate zones.\
6\. To export the management zones as a shape file, click the Export icon. The file can then be imported into a farm management tool.
## Standard Examples for Manipulating Map Layers
### Highlight the Best Area
1. Bins: 1
2. Min/Max: Minimum slider moved to the right
3. Color Scale: Red to green