> For the complete documentation index, see [llms.txt](https://support.senterasensors.com/home/llms.txt). Markdown versions of documentation pages are available by appending `.md` to page URLs; this page is available as [Markdown](https://support.senterasensors.com/home/fieldagent/how-to-order-view-and-analyze-a-stand-count.md).
# How to Order, View and Analyze a Stand Count
This guide goes through how to order, view and Analyze stand count withing FieldAgent Web and Desktop.
## FieldAgent Web
### Order Stand Count
1. Login to [FieldAgent Web](https://fieldagent.sentera.com/)
2. Scroll down on the left hand pane to the field you want to order stand count from and click on the field name.
3. Click Order Analytics button below map layers.
4. Select dropdown under Order Analytics and select Field Scale Stand Count.
5. Select the dropdown under survey and select the survey date in which you want to order the stand count.
6. Select the crop type
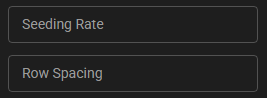
7. Type in the Seeding Rate and Row Spacing
8. (optional) Select the Output Unit System, i.e., select either Imperial or Metric (This is based on your user settings).
9. (optional) Leave blank unless instructed.
10. Click Submit.
11. Once the stand count has been processed you will receive an email like this.
Note: Field Scale Stand Count orders take less than an hour to process. This does require a internet connection to order a field scale stand count on FA Web.
{% embed url="" %}
### View Results
1. Login to [FieldAgent Web](https://fieldagent.sentera.com/)
2. Scroll to the field on the left hand pane and select the field
3. Select the "click to add a map layer" icon on the left hand side.
4. Find the survey date that you ordered the stand count and click on the name, i.e., it will be either "Stand Count - Individual" or "Stand Count - Rowfill".
5. It should then show the population count per acre on every dot.
### Analyze Results
In order to analyze the results you will need to do the following.
1. Click on the population dot on the stand count.
2. Select "Annotation 2" up on the top right corner of the image.
3. In order to manually analyze the image you can zoom in by using your mouse wheel or by clicking on the "+" or "-" buttons on the top right of the image too see all of the plants it counted. Note: If this is rowfill it will show a green line for where it is detecting a plant and red for where it is not detecting a plant and it will then estimate how many plants based on seed rate and row spacing and other calculations. In addition, when it individually counts the plant you will see a green dot for where it counted the plant and the blue line is where the row is that it counted the plant. When you order stand count It will only do rowfill if the plants are too big (beyond V2 stage) and are overlapping each other.
4. (optional) in order to manually calculate the population count and compare against automated count by moving the blue box over the plant row and make sure the blue marker is in the correct spot between the rows, you can use the  move icon to move the box and the  stretch icon to stretch out the row spacing or use the rotate icon to rotate the blue box. Then count every plant in the box and multiply it by 1,000 to get a manual estimate.
Note: Manual counts in a single spot may not equal the automated count which averages the entire image. It should come close to when comparing by going to "Count Details" and then looking at the "Crops Detected".
5. If you are noticing that the population average is off due to some population images that are not relevant, you can exclude the point to get the population average up by clicking on exclude the point toggle on the bottom right of the image.
## FieldAgent Desktop
### **Order Stand Count when importing**
1. Remove the SD card for your sensor and insert into your computer. This can be performed at the field edge without an internet connection.
2. Click on "Create Surveys" button up on the top right.
3. Click on Browse link up at the top of New Survey(s) popup or you can drag and drop the folders that contain the images. Then browse for the folder and select it if clicking on browse.
4. It will then show the field and how many images it contains, if it does not show the field name click on the  arrow icon by where it says how many images it contains and type in a field name and click on Save button.
5. Click on Create Import button
6. Once done you will see a analytics button, click on the button.
7. Select Field Scale on the left pane and choose the type of Stand Count and select Stand count or if out in the field with no internet, you can select Stand Count (Offline).
8. Click on Submit.
Note: Field Scale Stand Count orders take less than an hour to process. When ordering a FieldScale Stand Count on FA Desktop it does require a internet connection. In addition, if you are ordering field scale stand count (offline) it does not require internet.
### Order Stand Count for previous survey
1. Click on the field
2. Click on the checkbox by the survey date under surveys on the left hand pane.
3. Click on "order analytics"  button on the top center of the map.
4. Click on "Field Scale" on the left hand pane. Then click on the type dropdown and choose stand count. Then select Stand Count or if you are out in the field you can click on Stand Count (Offline) if you do not have internet.
5. Click on Submit
### View Results
1. Click on the Field Name
2. Click on the analytic name under image layers of either "Stand Count - Individual" or "Stand Count - Rowfill".
3. It should then show the population count per acre on every dot.
### Analyze Results
**Stand Count**
1. Navigate to the Field. Select "Stand Count - Individual" or "Stand Count - Rowfill".
2. Click on a population dot. If it is showing rowfill, it will show rows display a green line where is it counting the plant and red row where it is not counting the plant based on row spacing and seed rate and also other calculations.
3. Click on the spot scout toolbox up on the top left.
4. Move the slider bar left or right to adjust and remove certain values to view only what you need to see. In addition, you can click on the + or - under bins to get more detailed or less detailed on the stand count.
5. You should also be able to see the statistics on the field, i.e., the average, minimum and maximum for the stand count.
**Stand Count Heat Map**
1. Select the Stand Count Heatmap from the Image Layers menu. The field image displays high and low emergence in distinctive colors.
2. Click the Toolbox up on the top left of the window.
3. Move the slider bar left or right to adjust and remove certain values to view only what you need to see. In addition, you can click on the + or - under bins to get more detailed or less detailed on the heat map.
4. You should also be able to see the statistics on the field, i.e., the average, minimum and maximum for the stand count heatmap.
---
# Agent Instructions
This documentation is published with GitBook. GitBook is the documentation platform designed so that both humans and AI agents can read, navigate, and reason over technical content effectively. Learn more at gitbook.com.
## Querying This Documentation
If you need additional information that is not directly available in this page, you can query the documentation dynamically by asking a question.
Perform an HTTP GET request on the current page URL with the `ask` query parameter, and the optional `goal` query parameter:
```
GET https://support.senterasensors.com/home/fieldagent/how-to-order-view-and-analyze-a-stand-count.md?ask=&goal=
```
`ask` is the immediate question: it should be specific, self-contained, and written in natural language.
`goal` is optional and describes the broader end goal you are ultimately trying to accomplish on behalf of the user. GitBook uses it to tailor the answer towards what is most useful for that goal.
The response will contain a direct answer to the question and relevant excerpts and sources from the documentation.
Use this mechanism when the answer is not explicitly present in the current page, you need clarification or additional context, or you want to retrieve related documentation sections.




 rotate icon to rotate the blue box. Then count every plant in the box and multiply it by 1,000 to get a manual estimate.
Note: Manual counts in a single spot may not equal the automated count which averages the entire image. It should come close to when comparing by going to "Count Details" and then looking at the "Crops Detected".
rotate icon to rotate the blue box. Then count every plant in the box and multiply it by 1,000 to get a manual estimate.
Note: Manual counts in a single spot may not equal the automated count which averages the entire image. It should come close to when comparing by going to "Count Details" and then looking at the "Crops Detected".


